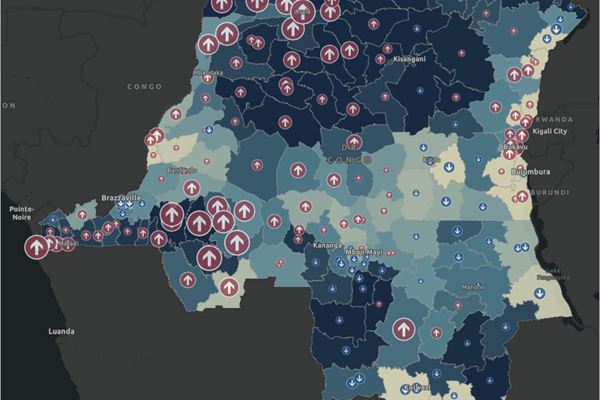
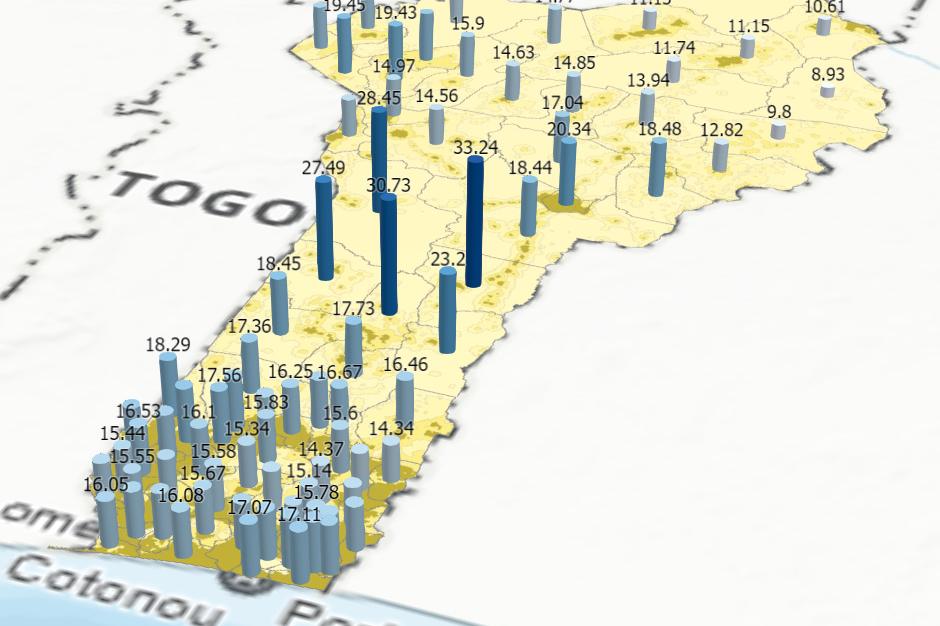
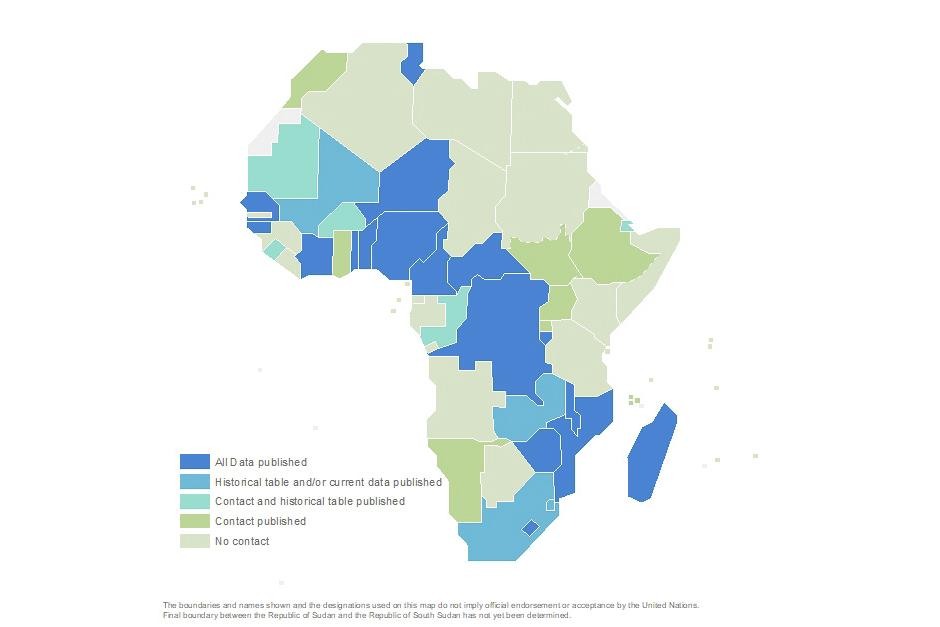
The story map below presents how geospatial data on precipitation and temperature through time and disaggregated at sub-national units can help understand regional climate impact for better planning of school calendars.The story map is a collaboration with the United Nations Educational, Scientific and Cultural Organization (UNESCO), International Institute for Educational Planning (IIEP), the full screen version is available here.
Second Administrative Level Boundaries
Geospatial Information Section & Statistics Division


